For most facility managers, the restroom remains the last frontier of building data. HVAC systems, lighting circuits, and access controls have been networked for years - yet the plumbing infrastructure consuming the largest share of a building's water budget has historically operated without a single data point. That gap is closing rapidly.
Toilets, sinks, and urinals account for approximately 60% of all water used in a commercial facility, according to industry analysis by Waterless Co.[1] - making restrooms the single highest-leverage target for water conservation programs. A new generation of IoT sensor networks and analytics platforms is placing that consumption under real-time scrutiny, with implications that extend well beyond the utility bill.
The Commercial Water Problem in Numbers
The scale of the opportunity is significant. The three largest uses of water in U.S. office buildings are restrooms, heating and cooling, and landscape irrigation, according to EPA WaterSense data[2]. IoT water monitoring platforms report[3] that real-time usage analytics can reduce building water consumption by 18-30% through identification of running toilets, dripping faucets, and other failures invisible to manual inspection.
Applied to a mid-size corporate campus with 300 employees, the math becomes compelling. According to Culligan Quench[4], a 300-employee office building typically uses between 4,500 and 6,000 gallons of water per day. A 20% reduction represents up to 1,200 gallons daily - and at the U.S. national average combined water and sewer rate of $12.42 per 1,000 gallons[5], savings accumulate quickly across a multi-site portfolio.
How Smart Toilet Analytics Actually Work
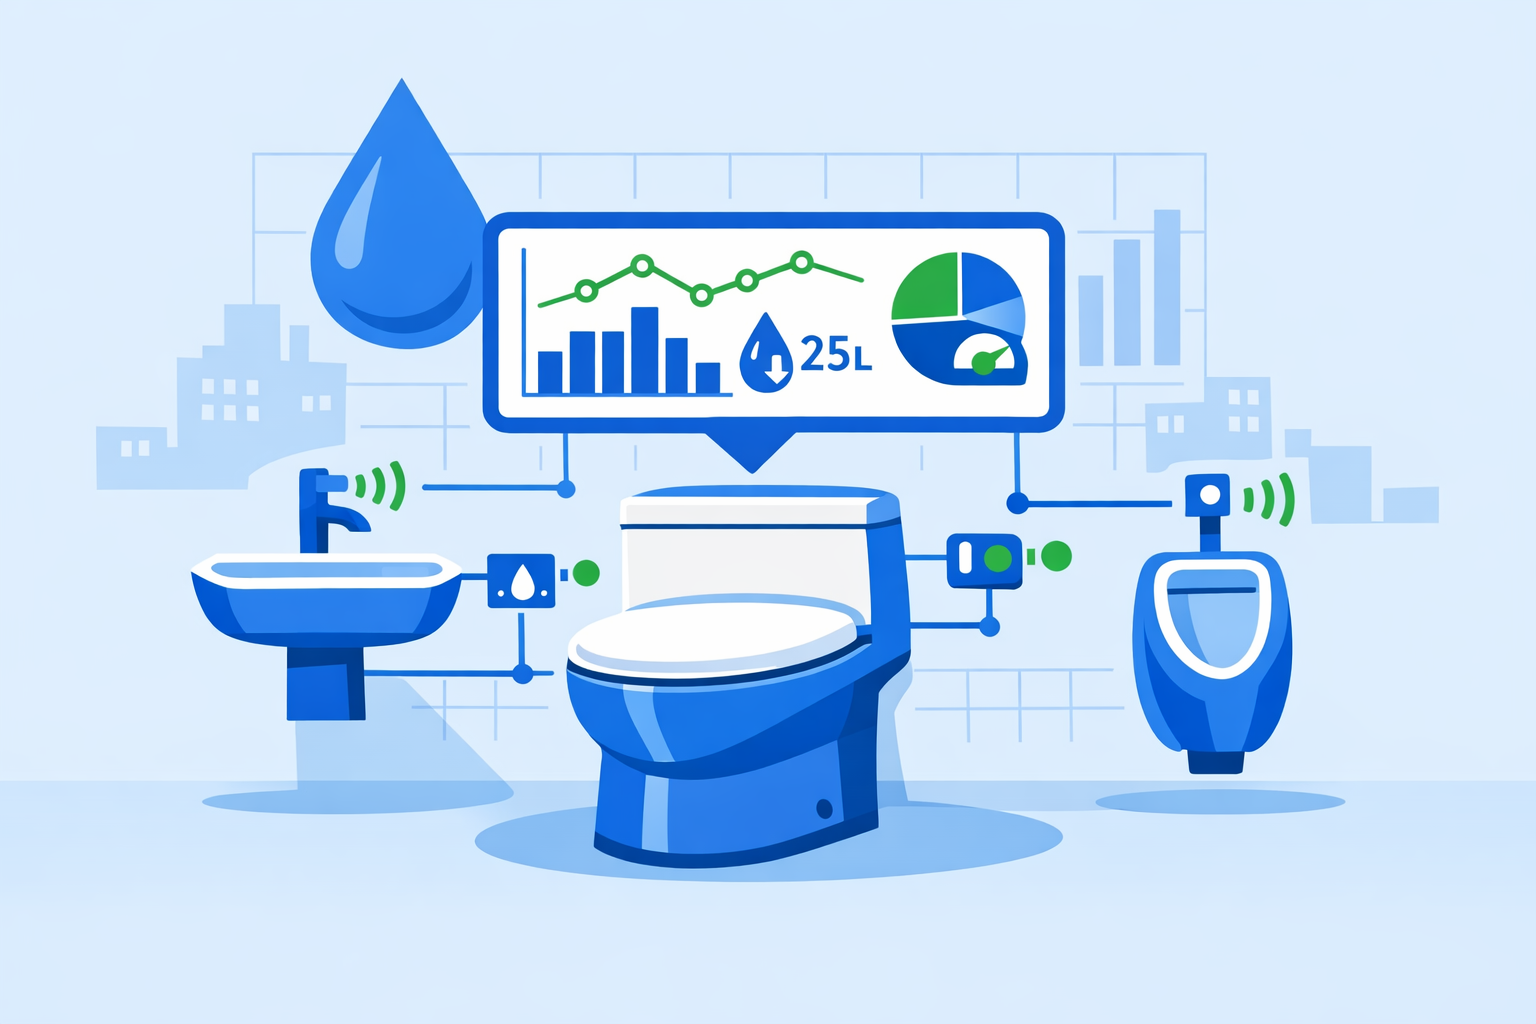
The technology stack behind restroom water analytics is more layered than a simple "connected toilet." Deployments typically combine three tiers of sensing:
- Flow meters and pulse sensors installed on the supply line to each fixture, logging volumetric consumption per flush event in real time
- Occupancy sensors (passive infrared or mmWave radar) that map restroom traffic patterns without capturing identifiable personal data
- Pressure and moisture sensors positioned at floor level or behind fixture casings to detect slow leaks and overflow events before they escalate
Smart BMS platforms[6] continuously track water flow across these zones and feed data to a central analytics layer. In 2025, BMS platforms have begun incorporating HVAC, electrical, and plumbing systems into a single unified interface for facility monitoring and control, a convergence that gives energy managers visibility across previously siloed systems. The analytics engine correlates flush events against occupancy signals to distinguish normal usage from phantom flushes, running valves, and leak events - each triggering a different operational response.
From Raw Events to Actionable Insight
Raw event logs have limited value without meaningful thresholds. The table below outlines the key metrics operations teams should configure when commissioning a smart restroom analytics deployment:
{{component:metrics-table}}
Setting these thresholds requires a calibration period - typically two to four weeks of baseline monitoring before alert rules go live. Operations teams that skip this step frequently find themselves overwhelmed by false-positive alerts, degrading trust in the system and reducing response rates.
BMS Integration: The Interoperability Challenge
The largest friction point in enterprise-scale rollouts is not sensor technology - it is data integration. Most legacy BMS deployments predate open data standards by a decade or more. Facility engineers and system integrators should specify the following in procurement documentation to avoid costly post-installation rework:
- BACnet/IP or Modbus TCP for wired fixture-level sensor communication to the BMS gateway
- LoRaWAN or Zigbee for wireless retrofit scenarios where cabling is impractical; LoRaWAN sensors can achieve up to 2 km range with IP65-rated enclosures[7], making them viable across large floor plates
- MQTT or REST API for cloud-based analytics platforms requiring upstream data forwarding
- Open API documentation from the analytics vendor to enable integration with third-party CAFM (Computer-Aided Facilities Management) or energy management systems
Without explicit interoperability requirements in the tender specification, operators frequently discover that proprietary vendor protocols create data islands that cannot surface in the central BMS dashboard - undermining the whole-building visibility that justifies the investment.
As earlier coverage of #smart-building-adoption-accelerates-amid}} and #i-forecasting-in-smart-buildings-faces-scale-and}} has documented, integration complexity and data governance gaps remain the most consistently cited obstacles to scaling pilot programs into enterprise rollouts. Water analytics deployments face the same structural challenges.
Sustainability Reporting and Green Certification Alignment
The business case for smart restroom analytics increasingly extends beyond utility savings. Water consumption data - when structured, time-stamped, and auditable - feeds directly into sustainability reporting frameworks and green building recertification cycles.
Sustainable water management is critical for achieving green building certifications including LEED, WELL, and BREEAM[6]. More specifically, IoT sensors can support up to 80% of the factors assessed under LEED for Building Operations and Maintenance (O+M)[8] when deployed across energy, water, and indoor environment categories.
LEED v5, released with updated guidance in 2025, shifts the focus from modeled predictions to measurable performance over time, according to analysis published by Buildings.com[9]. This shift makes continuous, sensor-derived water data especially valuable: auditors can now review time-series consumption records against occupancy-adjusted baselines rather than relying on design estimates. Smart BMS platforms automatically log water savings, track usage over time, and generate reports - making certification processes smoother and faster[10].
For energy managers building the internal ROI case, water savings also carry a carbon reduction component. Heating, pumping, and treating water all consume energy; reducing consumption therefore lowers Scope 1 and Scope 2 emissions, strengthening the link between water analytics and net-zero commitments.
The Privacy Dimension
Restroom monitoring raises legitimate privacy concerns that operations teams must address proactively, particularly in jurisdictions subject to GDPR or CCPA.
{{component:privacy-callout}}
The practical solution is to design data collection at the fixture and zone level rather than the individual user level. Occupancy counters that log aggregate traffic - "12 entries between 10:00 and 11:00" - rather than individual dwell times or user sequences provide sufficient data fidelity for water-budget modeling without generating personal data. Data retention policies should be documented, access controls applied to raw sensor feeds, and privacy impact assessments conducted before deployment in sensitive environments such as healthcare facilities or buildings with union-represented workforces.
Estimating Your Water Savings Potential
Use the interactive calculator below to model projected savings based on building fixture count, current flush volumes, and local utility rates.
{{widget:water-savings-calculator}}
From Pilot to Enterprise: A Deployment Roadmap
The most common failure mode for smart restroom analytics is not technical - it is organizational. Pilots succeed in a single building, then stall when procurement, IT, and facilities management teams cannot agree on a scalable deployment model. A phased approach reduces that risk:
- Baseline audit - Install sub-metering on a representative sample of restroom zones for 30 days. Quantify current consumption, identify anomalies, and establish per-occupant benchmarks.
- Pilot instrumentation - Deploy a full sensor suite (flow, occupancy, pressure, moisture) in one building or floor. Integrate the data feed into the BMS dashboard and configure alert thresholds.
- ROI documentation - After 60-90 days, compare metered consumption against the pre-pilot baseline. Quantify leak events caught, maintenance interventions triggered, and water volume saved. Calculate simple payback against capital cost.
- Procurement standardization - Use the pilot's interoperability experience to finalize protocol and API requirements. Issue a standardized specification for enterprise procurement.
- Portfolio rollout - Deploy in waves, prioritizing buildings with the highest water intensity or oldest plumbing infrastructure. Centralize analytics in a portfolio-level dashboard to enable cross-building benchmarking.
Hotels implementing IoT water monitoring have reported achieving ROI within 6-12 months through combined utility savings, reduced insurance premiums, and elimination of emergency plumbing costs[3]. Commercial office and mixed-use building operators with newer infrastructure can expect payback timelines in the 12-24 month range, depending on utility tariff structures and the baseline leak rate discovered during the audit phase.
Key Takeaways for Operations Teams
- Restrooms are the primary target. With approximately 60% of commercial water use attributed to toilet, sink, and urinal fixtures, restroom analytics deliver the highest water-saving yield per sensor deployed.
- Specify interoperability upfront. BACnet, Modbus, MQTT, and open API requirements must be written into the tender specification - not negotiated after installation.
- Align data with certification cycles. Continuous, auditable water consumption records directly support LEED v5, BREEAM, and WELL recertification under performance-based evidence requirements.
- Calibration matters. Occupancy-adjusted daily water budgets, reviewed after a 30-day baseline period, provide meaningful alert thresholds without alert fatigue.
- Address privacy in the design stage. Zone-level occupancy counting rather than individual behavioral tracking satisfies operational requirements while avoiding regulatory exposure.
The #smart-building-metrics-shift-toward-resilience}} makes water analytics a natural next chapter - one that connects utility management, sustainability reporting, and predictive maintenance in a single data stream. For facility managers and energy directors, the restroom is no longer just a maintenance obligation. It is a data asset.
{{component:faq}}